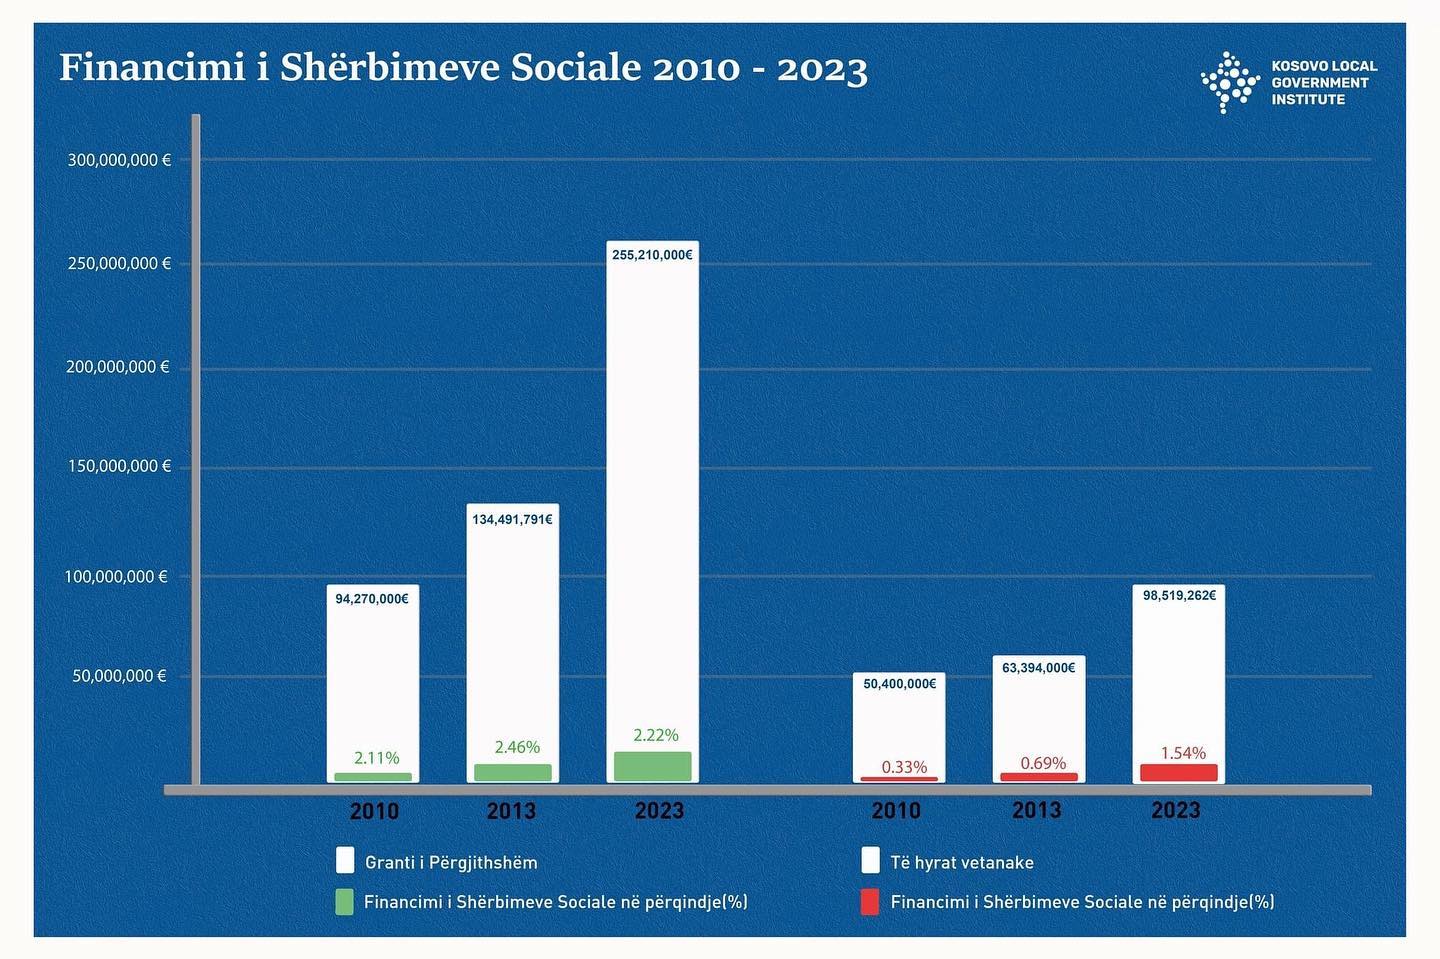
How were social services financed in municipalities between the years 2010, 2013 and 2023?
Differences in financing:
– General Grant ![]()
– Municipal Own Revenues![]()
Percentage differences %
– where there was a rise![]()
– where there was stagnation![]()
– and where is the decline![]() ?
?
Trends in the financing of social services, between the years (2010, 2013 and 2023), seen in percentage terms, have stagnated in terms of financing from the General Grant:
2010, 2.11% ![]()
2013, 2.46% ![]()
2023, 2.22%.![]()
Meanwhile, from Municipal Own Revenues, we had the following percentages of funding by year:
2010, 033% ![]()
2013, 0.69%![]()
2023, 1.54%![]()